Below are some interesting trends we found related to maltreatment, in various forms. We wanted to see if the
State of Indiana is consistent with the national trend.
Graph plotting Maltreatment of Children by County in Indiana
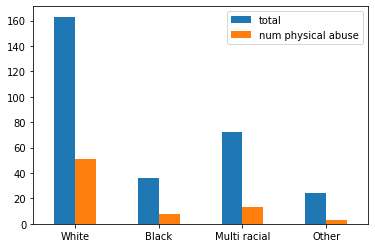
Physical Abuse and Race Comparison
Here is a bar graph that shows some basic, but important information on how race potentially plays a role in
the likelihood of physical abuse. This is an important trend to investigate because it offers more insight
on the maltreatment that occurs in Indiana.
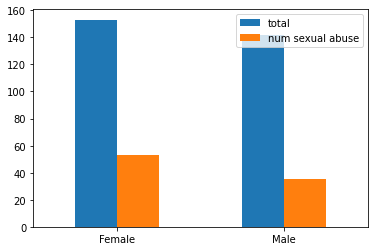
Sexual Abuse and Gender
Here is a bar graph that shows some basic, but important information on how gender may play a role in the
likelihood of sexual abuse. We can see a correlation here that females are more likely to experience sexual
abuse.
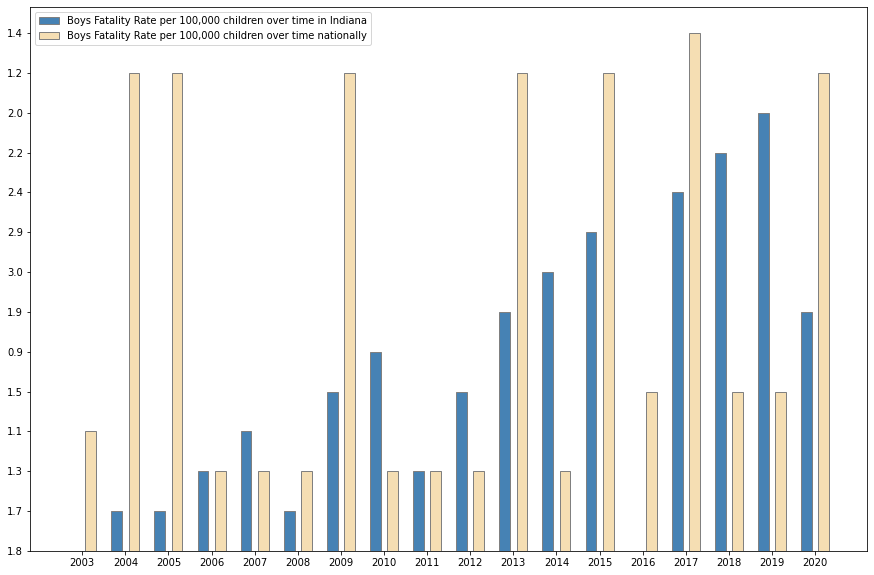
Boys Fatality Rate Indiana v. National
Here is a bar graph that shows the change in fatality rate for boys over the years 2003 to 2020. We see a
general increase over the years.
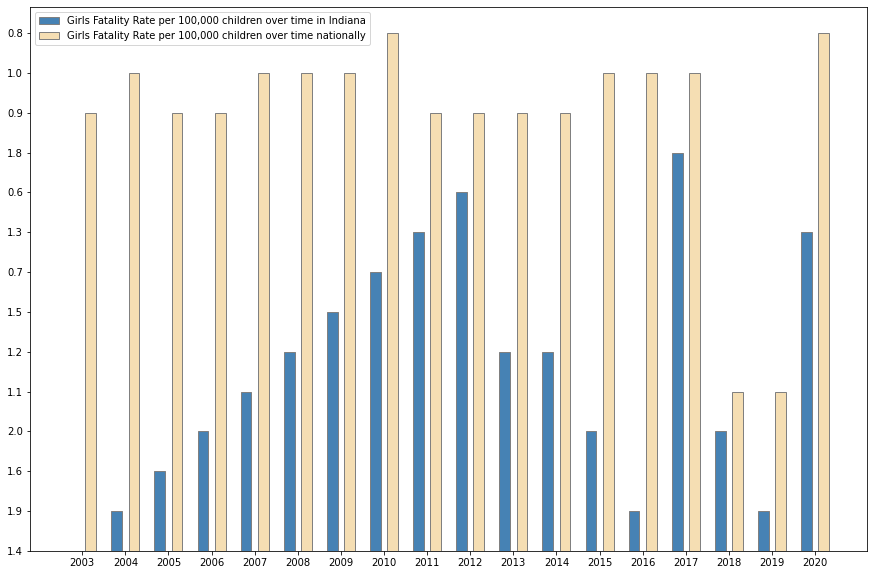
Girls Fatality Rate Indiana v. National
Here is a bar graph that shows the change in fatality rate for girls over the years 2003 to 2020. We see a
general increase over the years. There is a sudden dip around 2013, but spikes back up in 2017. That is
something interesting to potentially investigate.
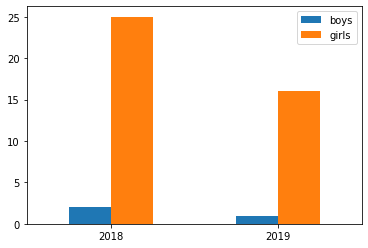
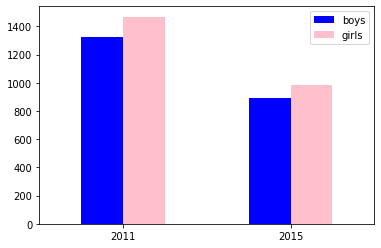
Sex Trafficking Gender Comparison in Indiana
Here is some more information in a bar graph that compares sex trafficking on the basis of gender in
Indiana. This is important information to understand because it shows a significant difference in the amount
of girls and boys that are trafficked in Indiana.
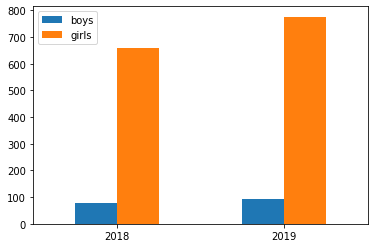
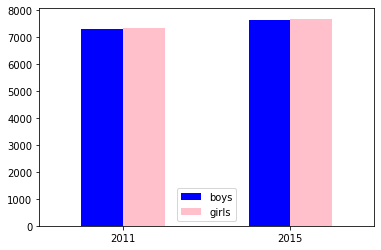
Sex Trafficking Gender Comparison in USA
This information further parallels the last graph, but on a much wider scale. We still see a very distinct
difference in sex trafficking on the basis of gender.
Online Bullying on Gender in Indiana
An analysis on online bullying on the basis of gender produced similar results regardless of gender. This
will be the general trend as we dive deeper and examine other forms of bullying on a bigger scale.
Online Bullying on Gender in USA
Like mentioned before, online bullying on the basis of gender produced very similar results; this bar graph
makes them look nearly identical. There is no correlation, or distinct difference, for online bullying in
the USA.
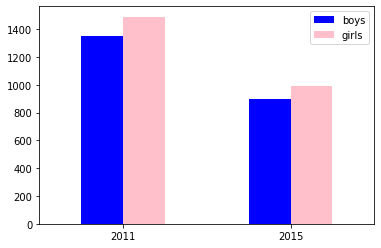
School Bullying on Gender in Indiana
School bullying on gender produced close results, but we saw bullying for girls to be a bit more in the
state of Indiana.
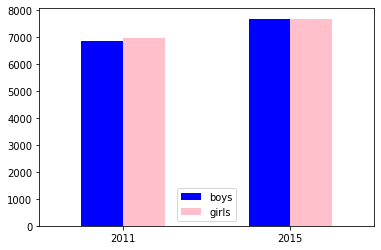
School Bullying on Gender in USA
We compare the previous findings by complimenting it with an analysis on a national level. From here, we saw
school bullying take a huge rise.
Summary/Main Takeaways
There is some interesting information that could be further examined. For example, we could
look more into
the various abuses (physical and sexual) and see if there are more correlations. Gender and race are two
categories that are prevalent commonalities in many trends, but we are sure that other commonalities lie
outside of the data set.
There is also great information provided on bullying, and although there is not a correlation, the numbers
are awfully high. There can be more investigation into the various reasons for bullying, and whether or not
there is a reason that is more prevalent in boys than girls, or vice versa.