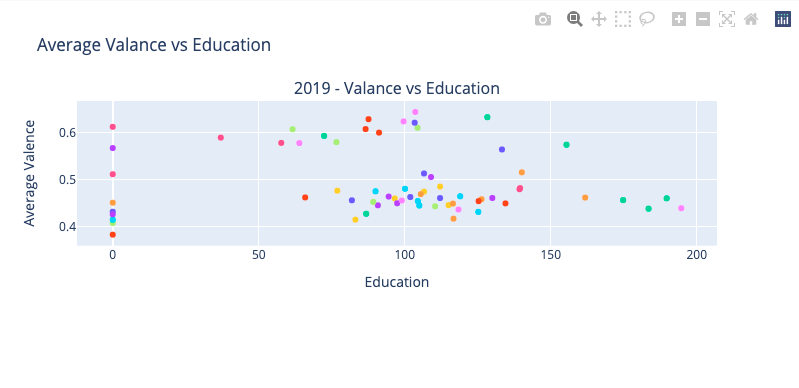
Education vs Average Valence
Scatterplots Displaying The Correlation Between Education Levels and Valence
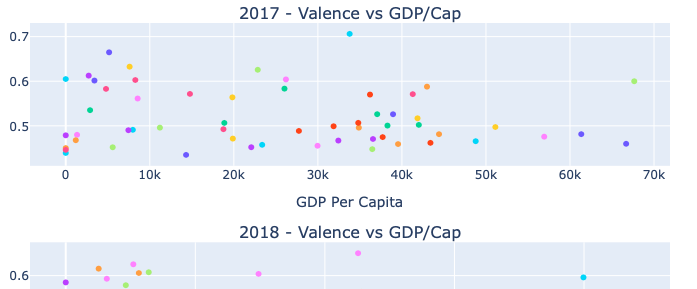
GDP Per Captia vs Average Valence
Scatterplots Displaying The Correlation Between Wealth Distribution and Valence
Scatterplots Displaying The Correlation Between Education Levels and Valence
Scatterplots Displaying The Correlation Between Wealth Distribution and Valence