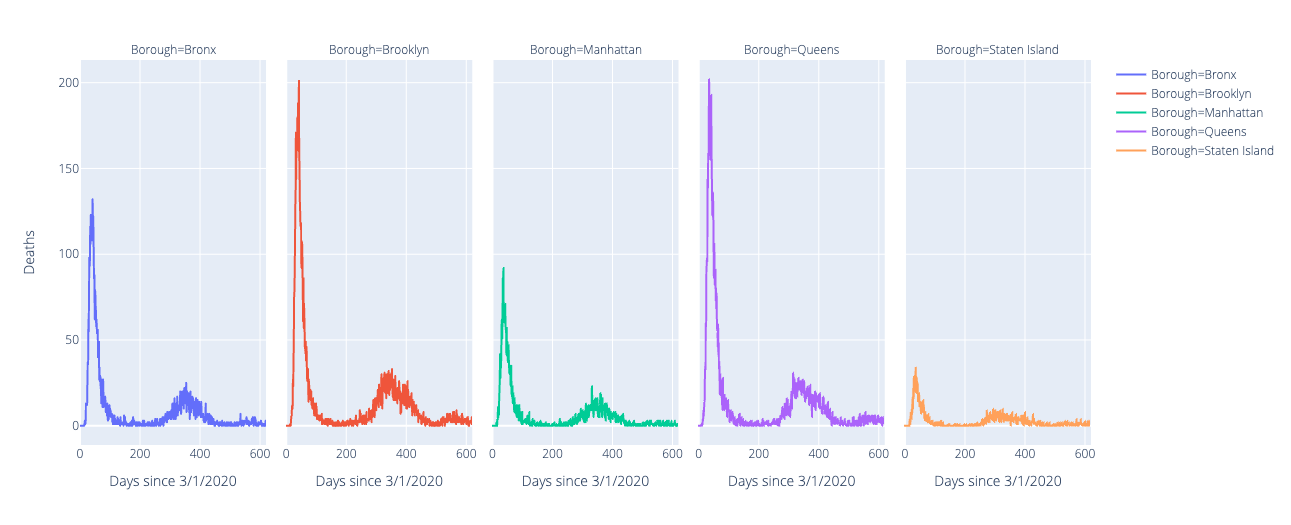
Daily COVID-19 Cases by Borough
From the graph above it appears that there is a general pattern that each of the boroughs followed. There is obviously variance in the raw population numbers of the boroughs, but for the most part, the regions seem to be following the same trend of reported COVID-19 cases. The only major difference amongst the boroughs is the magnitude of the first and second peak of reported cases. For the Bronx, Queens, and Staten Island, the first peak is larger in magnitude than the second, but for Brooklyn and Manhattan the second peak is larger than the first. This difference is quite interesting and provokes many questions as to the cause of this trend.
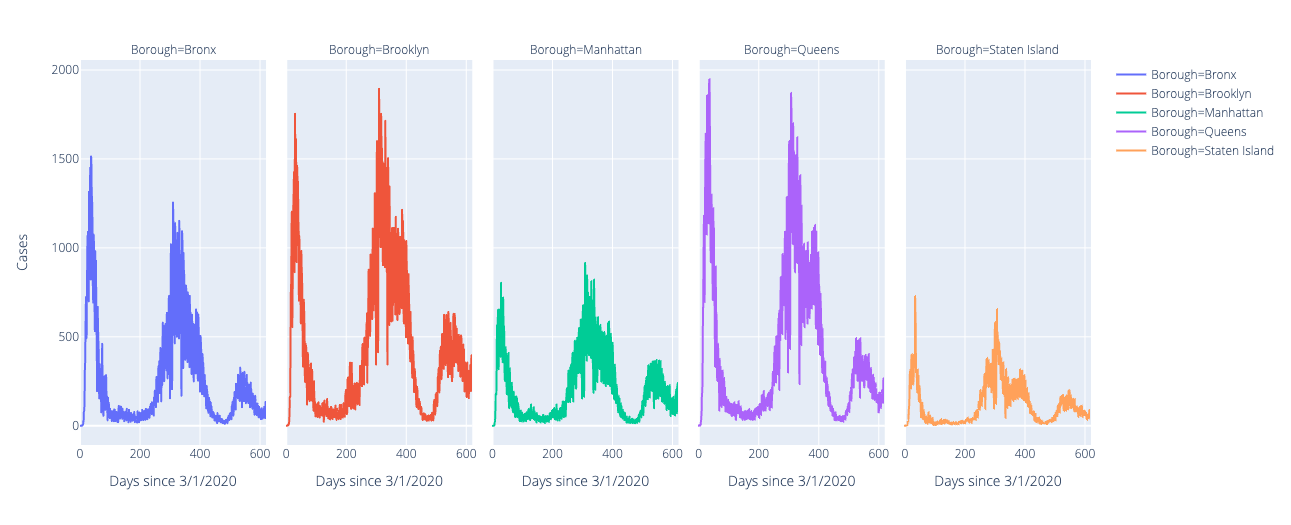
Daily COVID-19 Hospitalizations by Borough
From the graph above it appears the general trend for hospitalizations amongst boroughs is similar, but there is more variance than the graphs of reported cases. For example, in Manhattan the second peak of hospitalizations, which was during the same period of the second case spike, is significantly smaller than Manhattan’s first peak. The same phenomenon is true for Staten Island. This may be due to vaccinations or the public’s perception of the virus changing. Still, it’s interesting that the general trend for hospitalizations per day amongst the five different boroughs is quite similar, barring differences in magnitude caused by population variance.