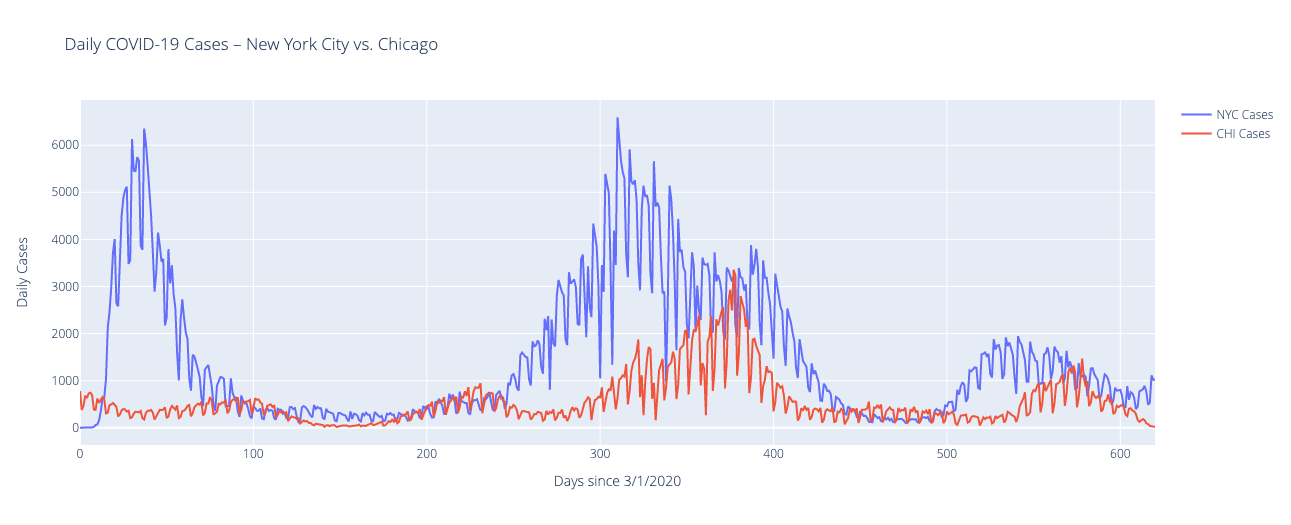
Daily COVID-19 Cases for New York City and Chicago
This graph is interesting because although NYC and Chicago are two entirely different cities, the general trend of daily COVID-19 cases over time is quite similar. There are differences in the raw numbers because of population variance amongst the two cities, but the peaks and troughs align for the two cities. The major difference between the two cities is from day 0 to 100 where NYC’s daily cases shot up to a major peak, but Chicago’s cases steadied and only gradually rose. This suggests that COVID-19 spread in NYC much earlier and faster than in Chicago.

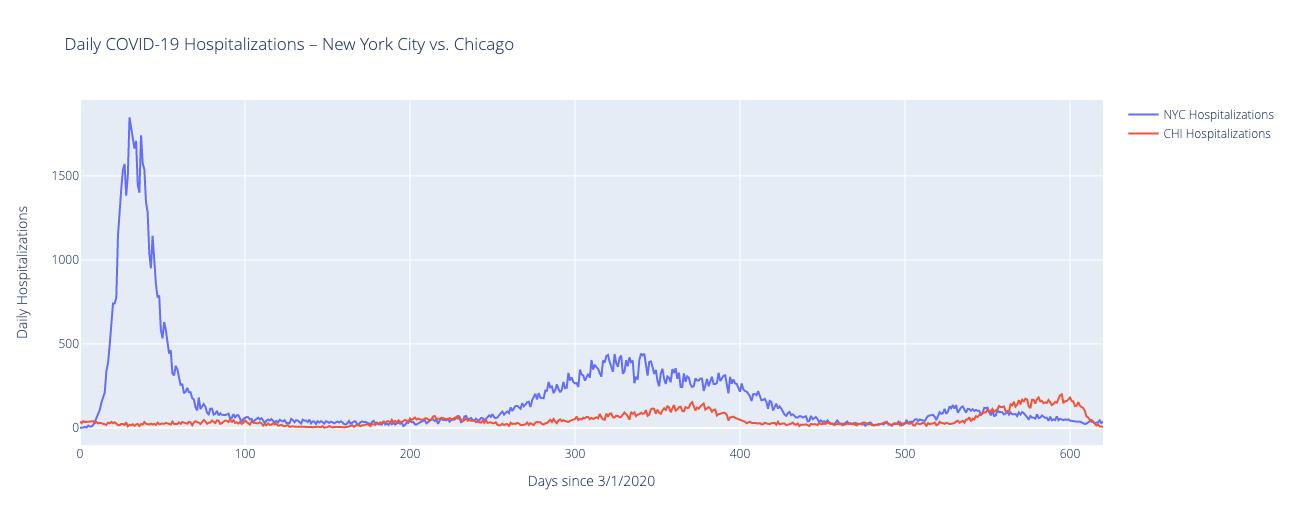
Daily COVID-19 Hospitalizations for New York City and Chicago
In this graph it can be seen that NYC’s daily COVID-19 hospitalizations were significantly higher than Chicago’s, especially in the beginning stages of Covid. This phenomenon was also true for NYC and Chicago’s daily case data, but the trend is even more severe in the hospitalization data. This may be due to a quicker spread of COVID-19 in NYC, or potentially a deadlier strain of the virus spreading in NYC.

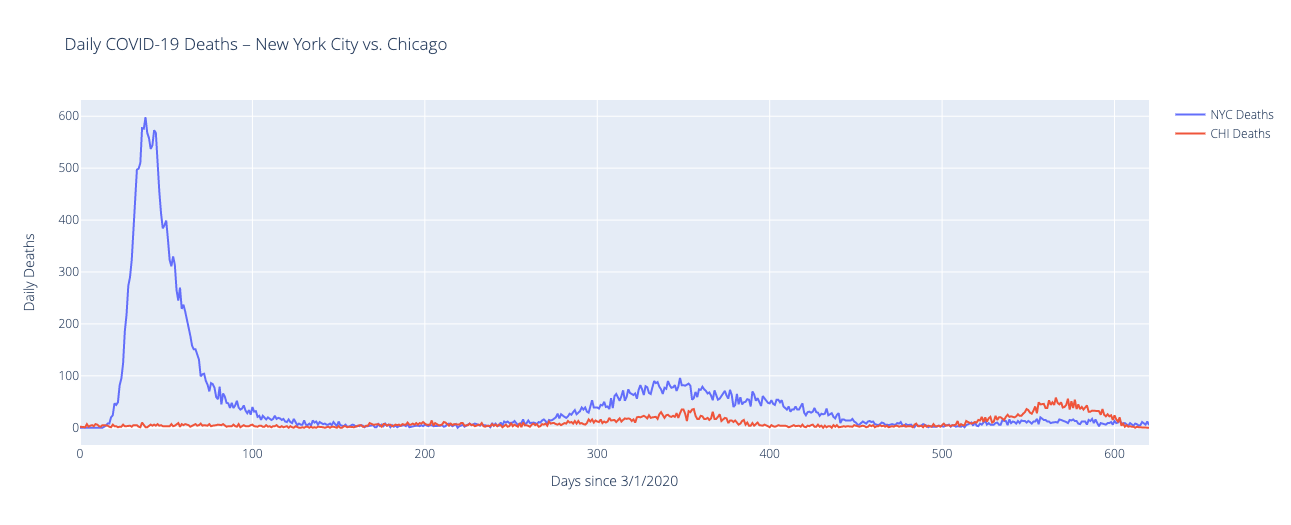
Daily COVID-19 Deaths for New York City and Chicago
This graph illustrates that daily COVID-19 deaths in NYC were far greater than that of Chicago during the beginning of the pandemic, but became similar as the pandemic continued. Again, it must be noted that the population of NYC is nearly 4x that of Chicago, but even proportionally NYC had much higher death rates than Chicago.