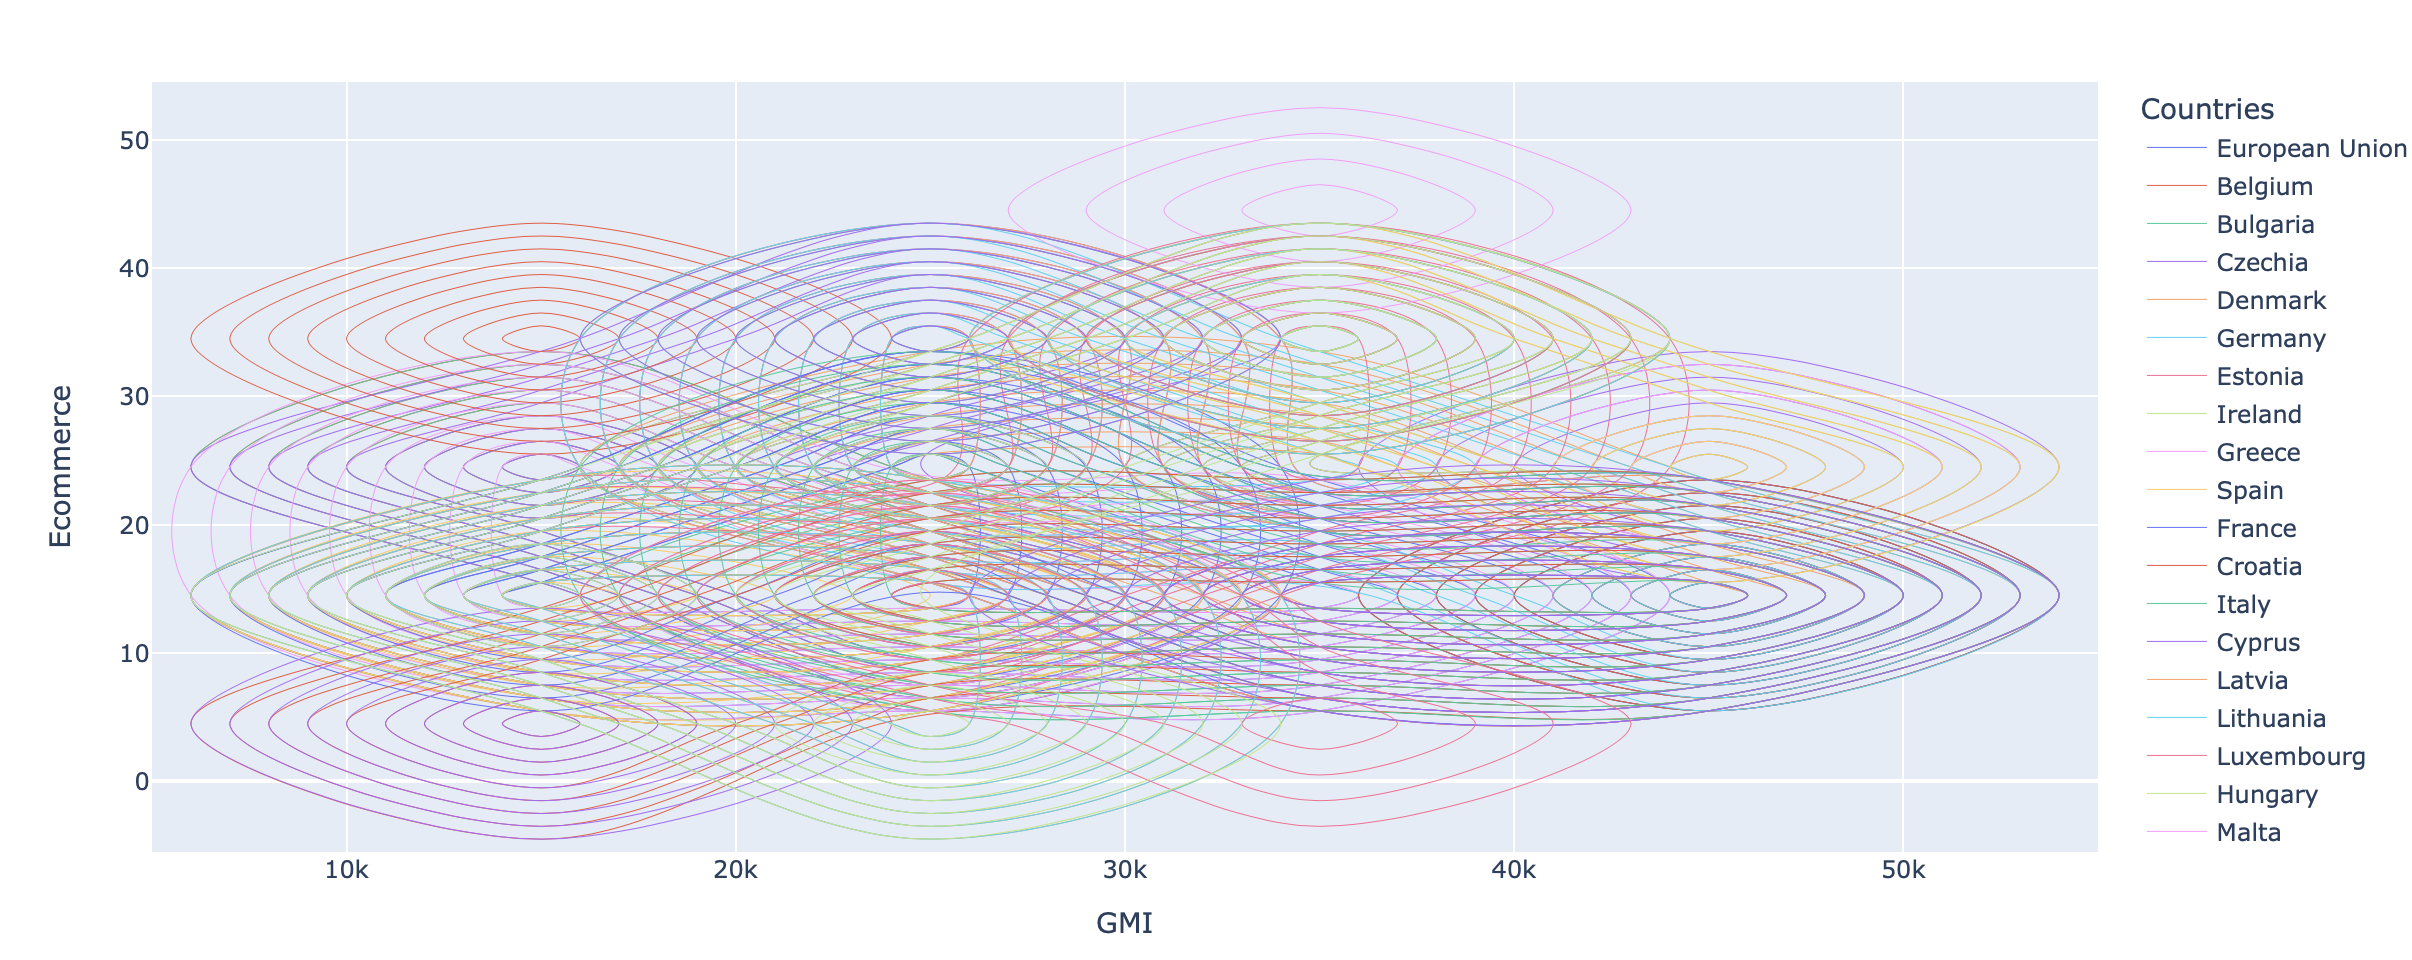
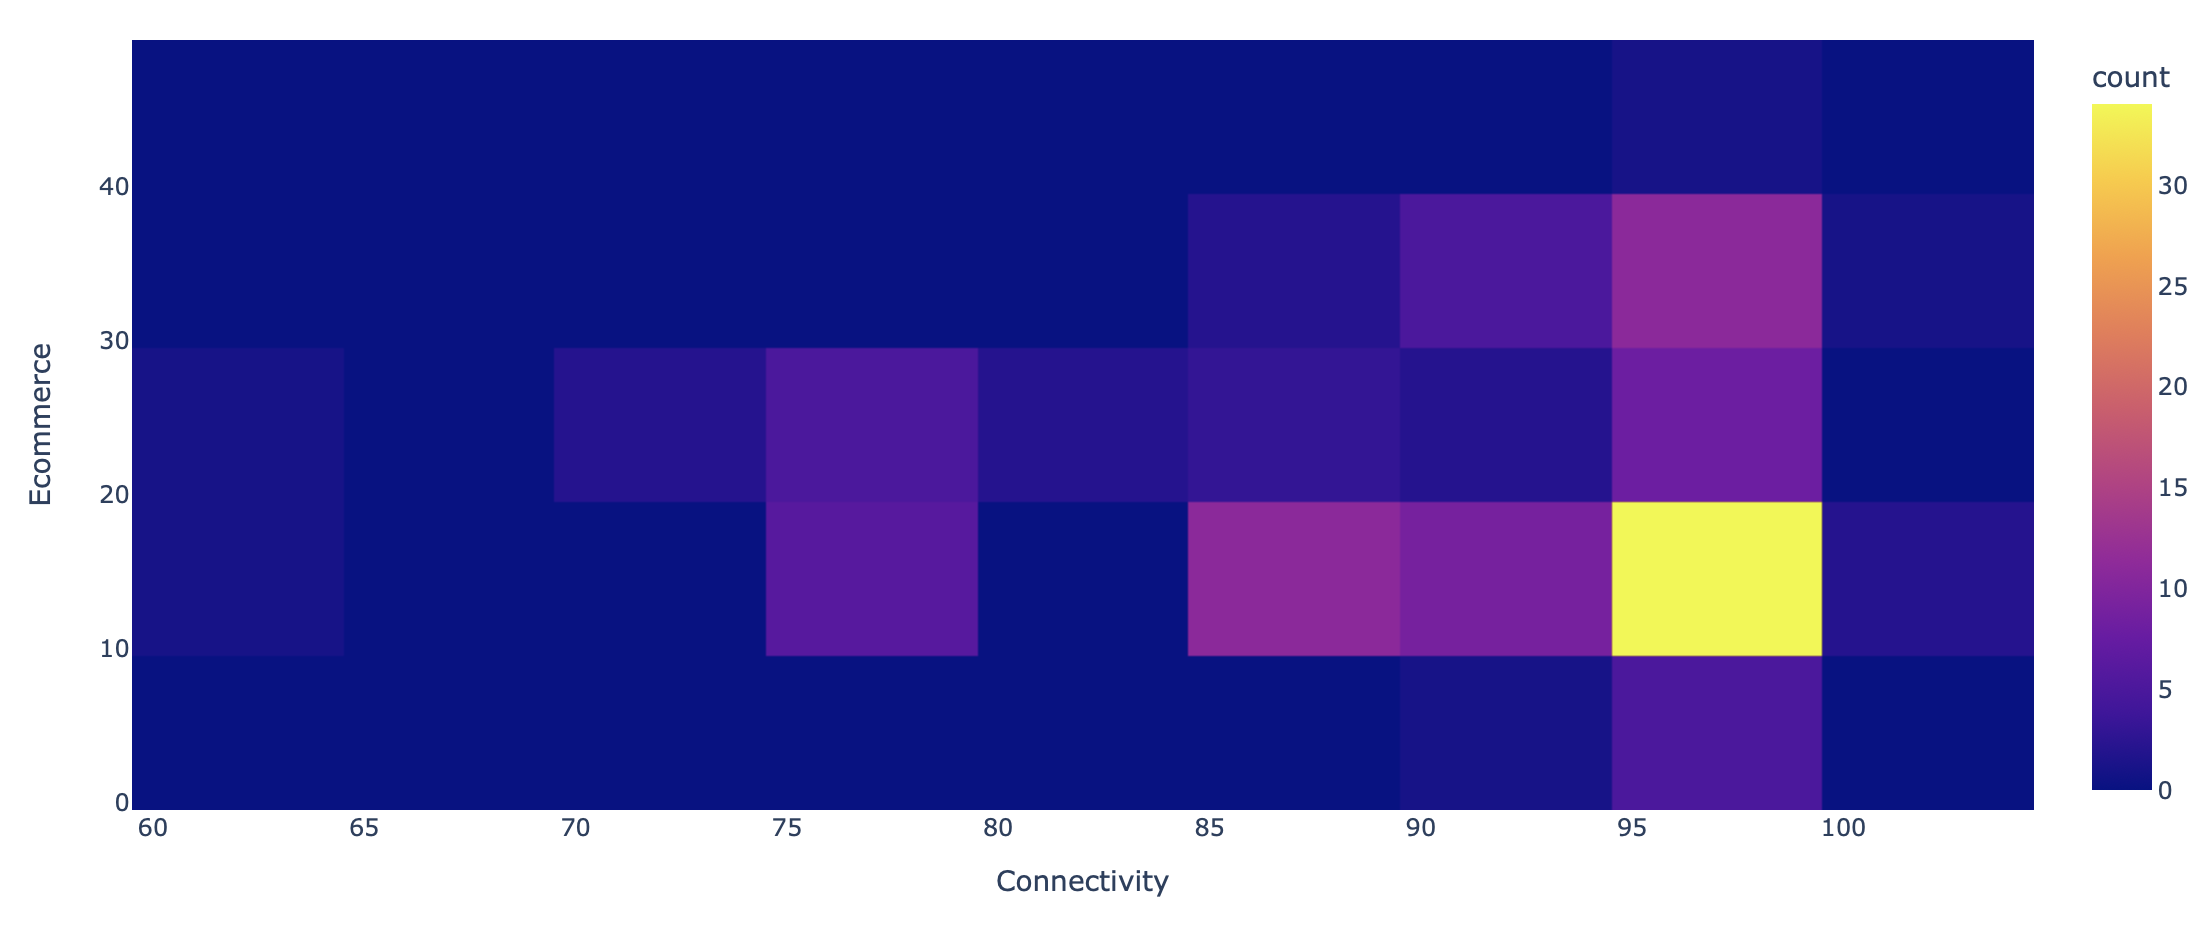
The first graph of e-commerce against GMI shows an interesting trend between the two. The graph shows the percentage of the market share that e-commerce takes up. E-commerce is any monetary exchange that occurs online. First, as a whole, countries tend to do better when they have a high e-commerce percentage. However, the countries with the highest GMIs averaged around 30% of the market being e-commerce, while some countries, such as Greece, got as high as 50% of the market as e-commerce. This shows that while having a high percentage of the economy as e-commerce is generally good, it does not necessarily make it the strongest economy. The heat map shows that, in general, there is a direct correlation between internet connectivity and e-commerce. This graph also shows the majority of countries are fairly connected to the internet, which will only make e-commerce and computer literacy more important in the future. However, if you look at the e-commerce % bar graph (link below), you can see that computer literacy and e-commerce are not directly related. This graph also shows that, overtime, the level of e-commerce in the market has been generally increasing. These five details shown by the graphs highlight the need to have a market connected to the market, but not necessarily skilled with computers, in order to maximize proficiency in e-commerce. As a whole, though, countries do not need to completely depend on e-commerce to have a strong economy, but should have a strong e-commerce presence and be preparing for it to be even larger in the future.
Link to economics colab