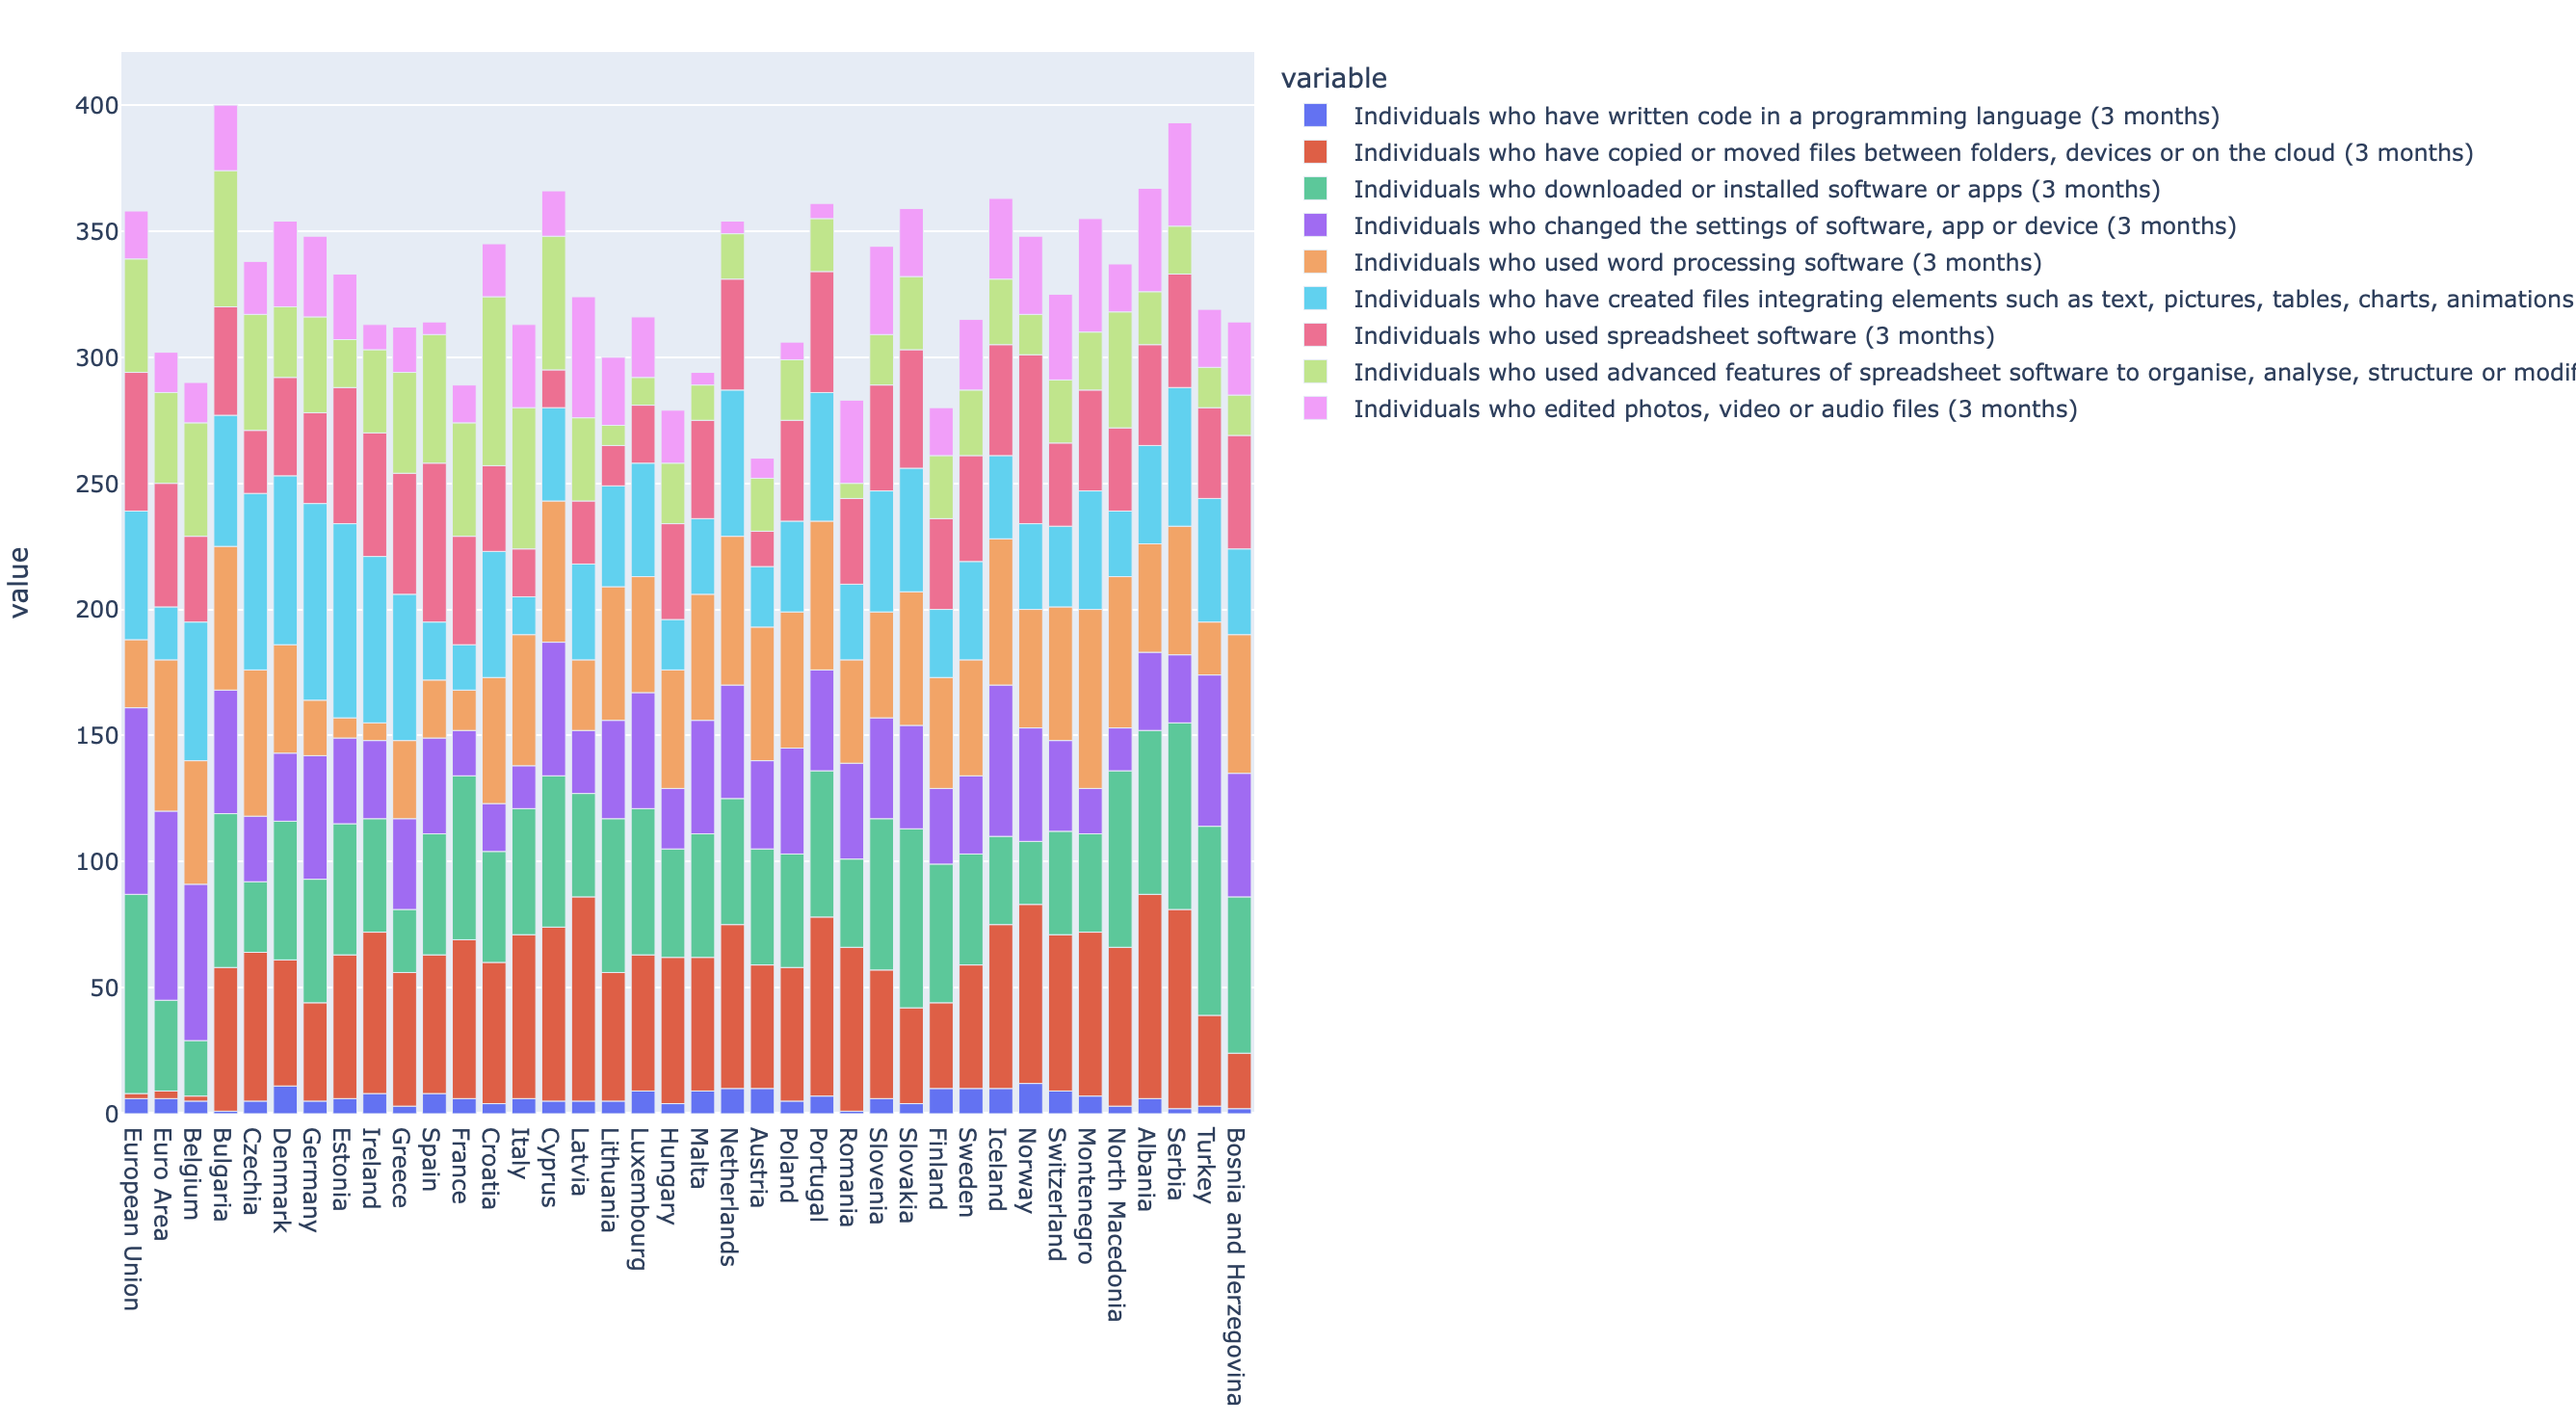
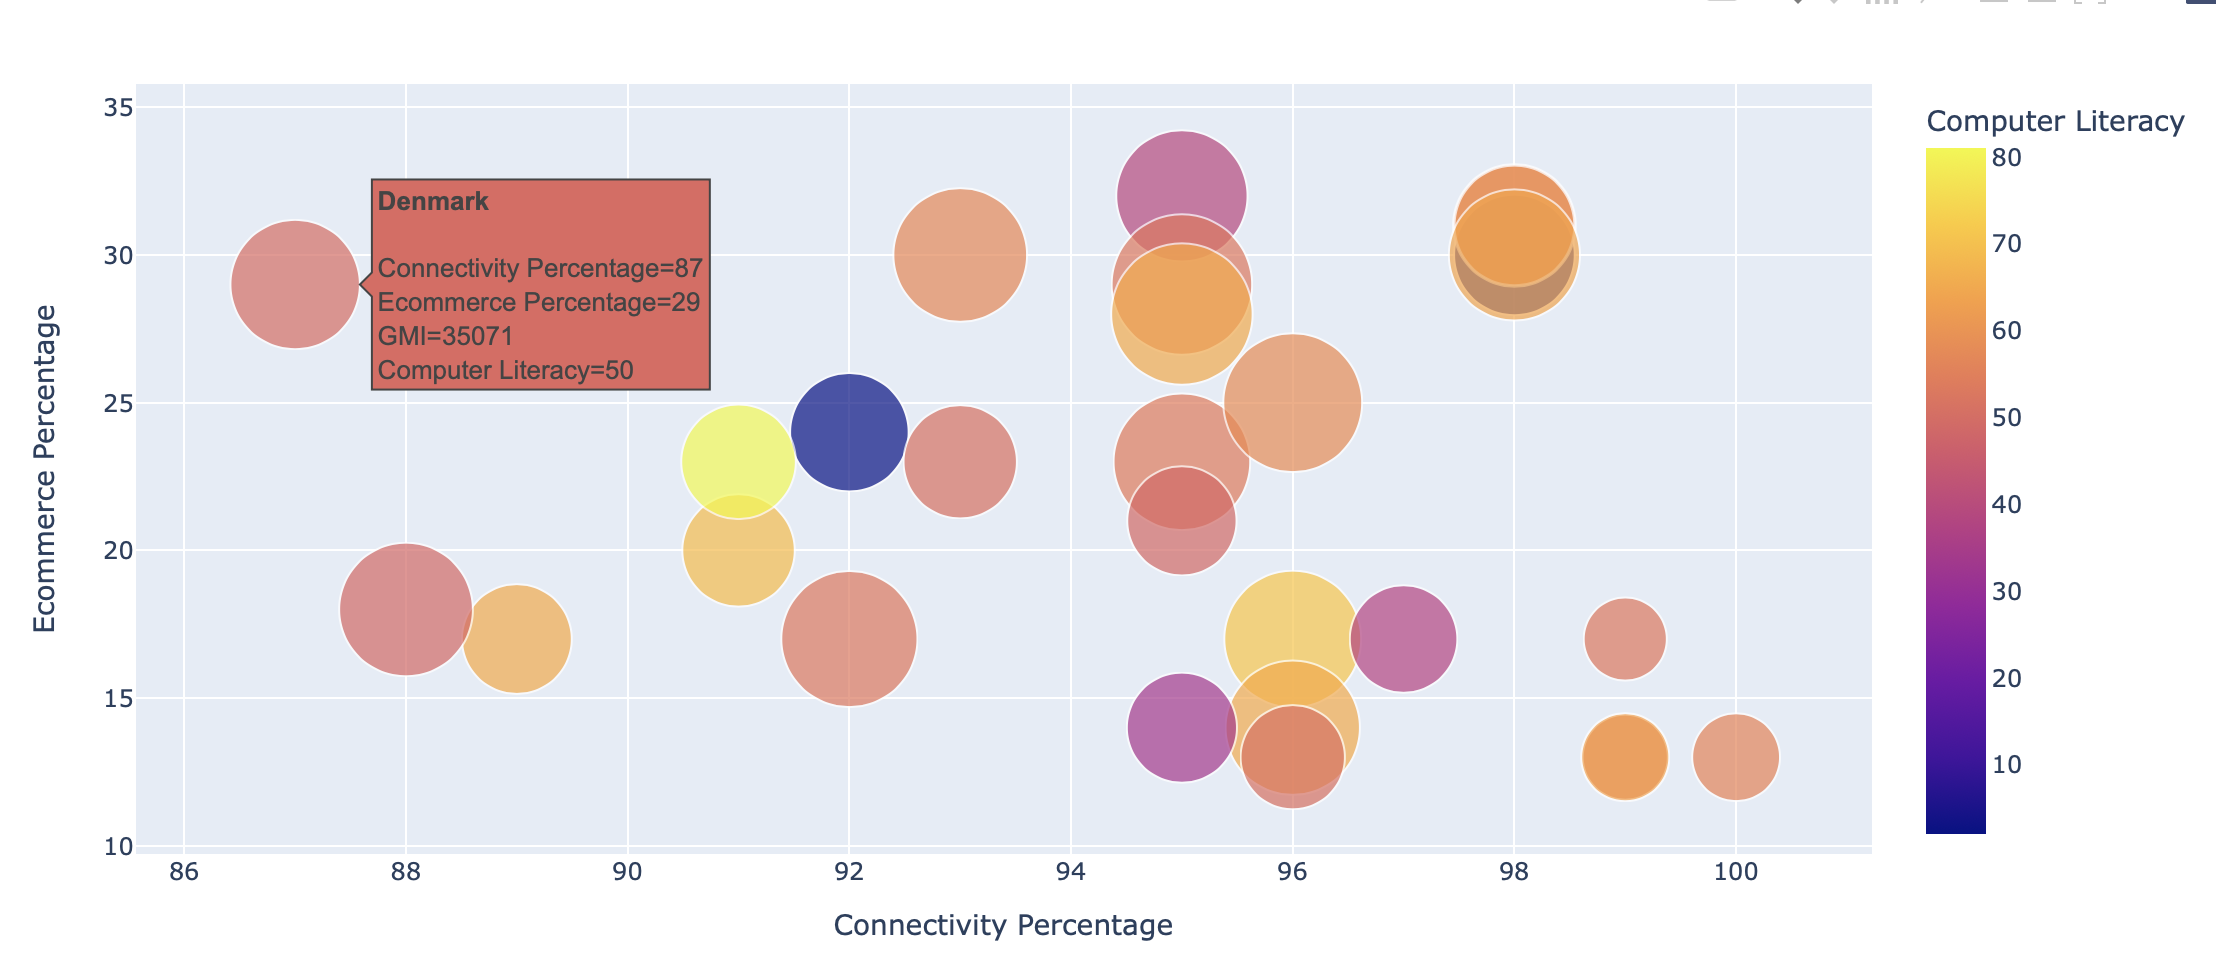
Our look into the progression of society showed several things. First, we noticed that, as a whole, societies vary significantly in their computer literacy metrics. We found that despite similar geographic locations and populations, computer skills were often very different. As you can see on the graph, certain countries with western values, such as France and Belgium, scored significantly lower than less progressive countries, such as Bulgaria. Originally this was surprising, but looking at the computer skills and health master graph (linked below), we can start to see why. Countries with the highest computer skill ranking also tended to have higher depression ratings, both moderately severe and severe. Another important graph is the bubble graph. This shows that being connected to the internet and having computer skills are not significantly related. There is a slight trend, but overall most countries have a wide variation. There was also a very small trend showing e-commerce and connectivity were related, but that having high connection did not necessarily mean high e-commerce. This pairs also with the graph of Gross Median Income and Computer Literacy. This graph shows that for the years between 2017-2020, countries with the highest Computer Literacy did not score the highest in GMI. They did, however, tend to do better than countries with lower Computer Literacy scores. The countries with the highest GMI were often between the 55-75% range for Computer Literacy. The only factor that Computer Literacy did not seem to affect was the BMI scores of countries. There were not significant differences in dangerous weight and normal weight based on Computer Literacy. These three takeaways show that the most effective societies possess competent Computer Literacy skills, but do not overemphasize it and do not necessarily score in the highest percentile.
Link to society colab