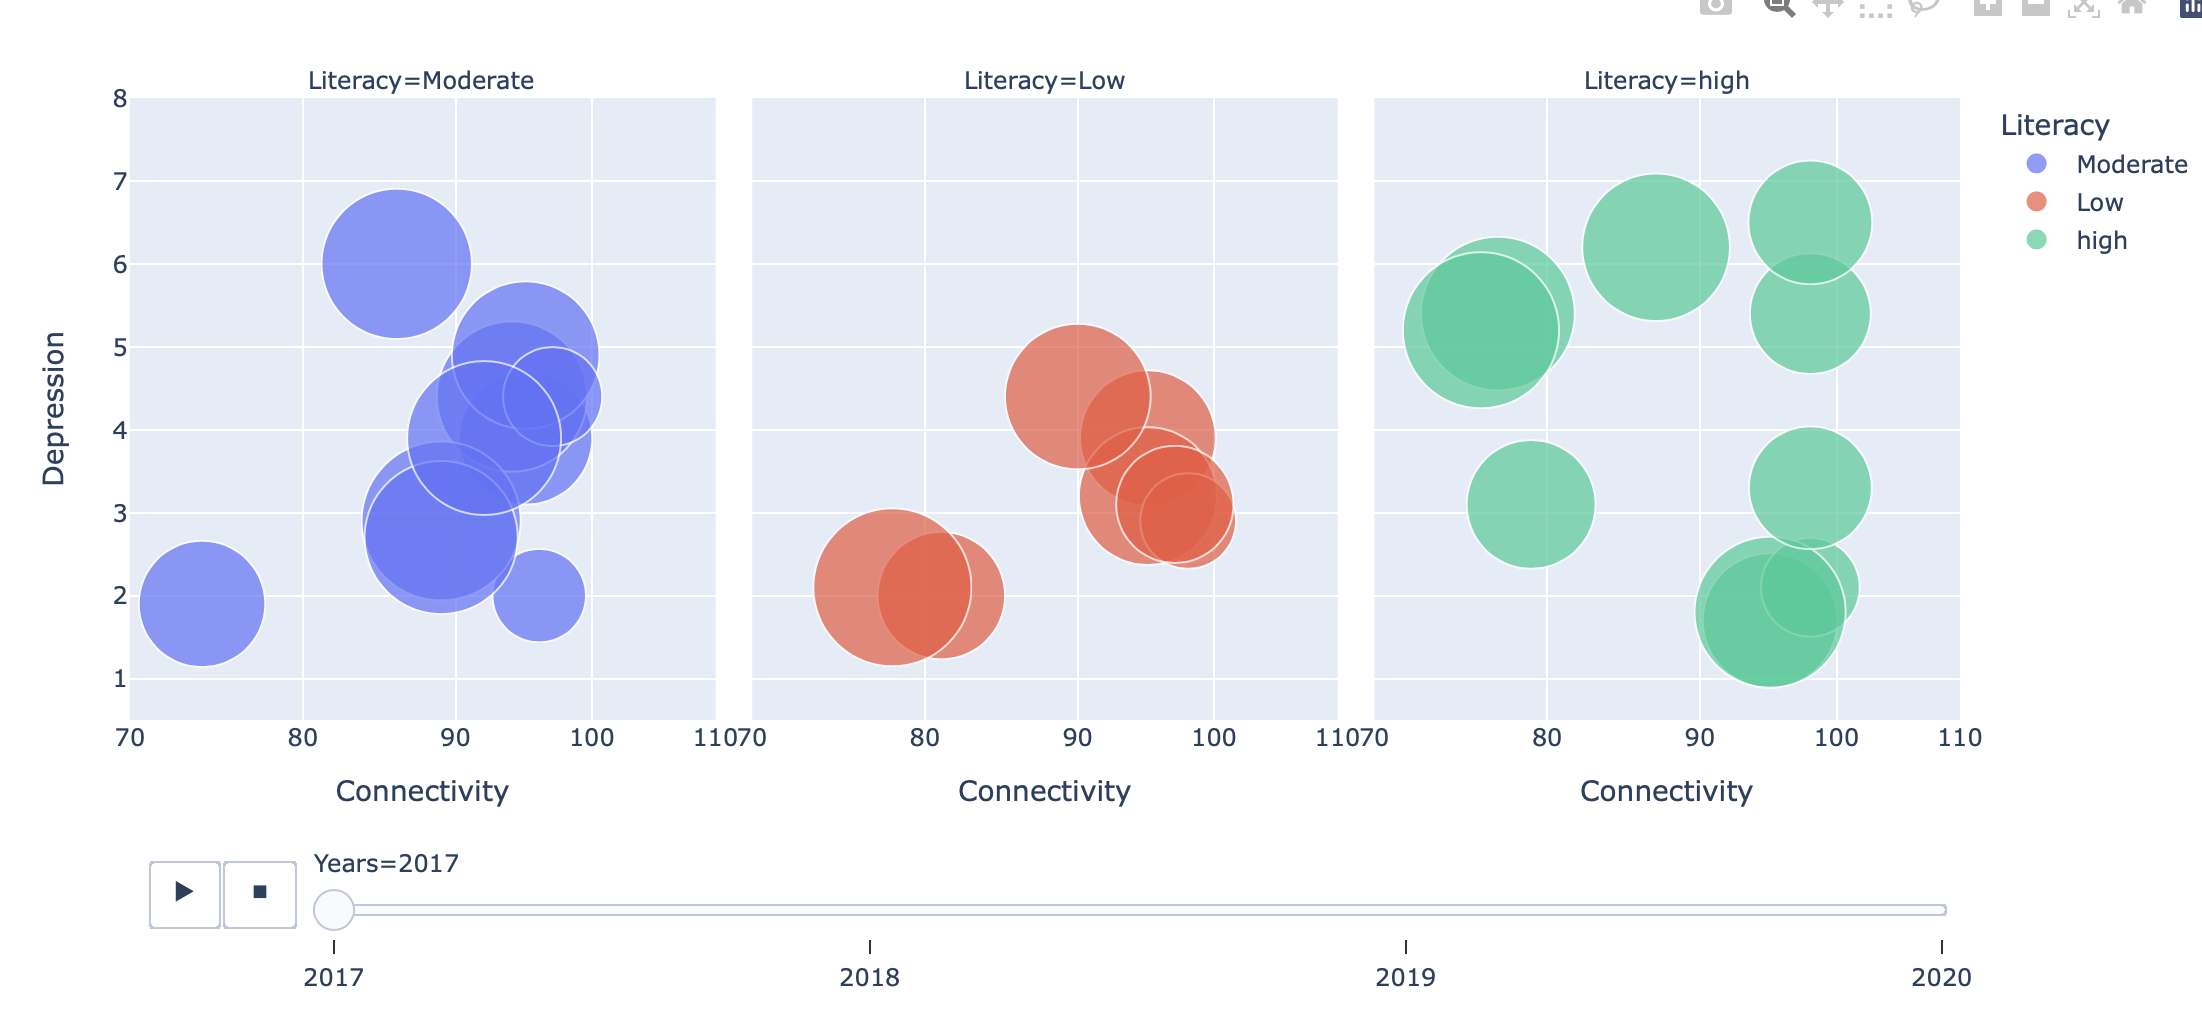
The animation bubble graph shows a few key factors. First, there is not a major correlation between a society’s GMI and its depression rating. This is interesting because it shows that economic prosperity or struggles do not truly lead to higher mental health struggles. The greater trend was with connectivity ratings and computer literacy. To begin, countries with high computer literacy also had a high depression population with moderate to severe depression ratings (percentage of people with moderate to severe depression symptoms). High computer literacy means over 65% of the citizens are computer literate, while medium is between 45% and 65%, and low is below 45%. The second highest depression scores came from the countries with a medium computer literacy score. Lastly, countries with the lowest computer literacy scores had the least percentage of people with moderate to severe depression symptoms. This was a distinction that was also true for the connectivity of countries, where the most connected countries had the highest depression ratings. This graph also shows us that connectivity has only been increasing in recent years. If we look at the depression map (linked below), we can see that a majority of countries in Europe face problems with depression. There is not necessarily a causation, but there certainly is a correlation between most of the countries having strong connectivity scores and high levels of depression. The same cannot be said for physical health, though. There is a wide variety in physical health by BMI within Europe (linked below). Therefore, these four findings from the graphs make it clear that Europe is seeing a rise in depression stemming not from monetary factors, but rather higher digitalization. Physical health, though, does not seem to be following the same path.
Link to health colab