A look into how Representative Alexandria Ocasio-Cortez (AOC) uses Twitter
Basic Stats:
Twitter Handle
Average Likes per Tweet
Size of Data set
Average Length per Tweet (Characters)
Duration
Frequent Word
@AOC
60,492
165
276
N/A
GOP
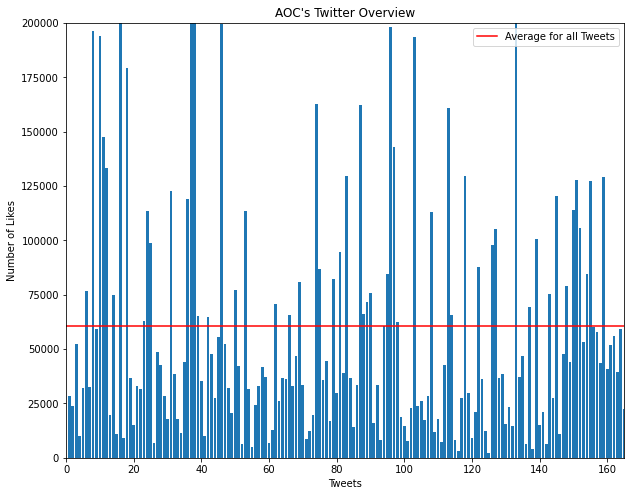
Graph 1: Account Improvement
This bar graph analyzes the relationship between tweets and their likes. Because our sample size for AOC’s tweets was relatively small (~200), we compared each individual tweet. The data shows that the average number of likes was about ~60,000.
Insight: AOC’s tweets get 60,000 likes on average
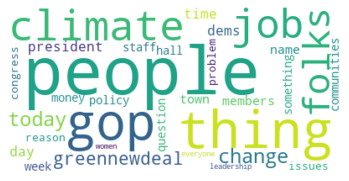
Graph 2: Word Cloud
This word cloud analyzes AOC’s most popular words used during her tweets. This graph portrays the frequency of particular words by portraying more frequent words as bigger than the others.
Insight: The most popular twitter words for AOC were “People”, “GOP”, “Climate”, “Job”, “Thing”, and “Folks”.
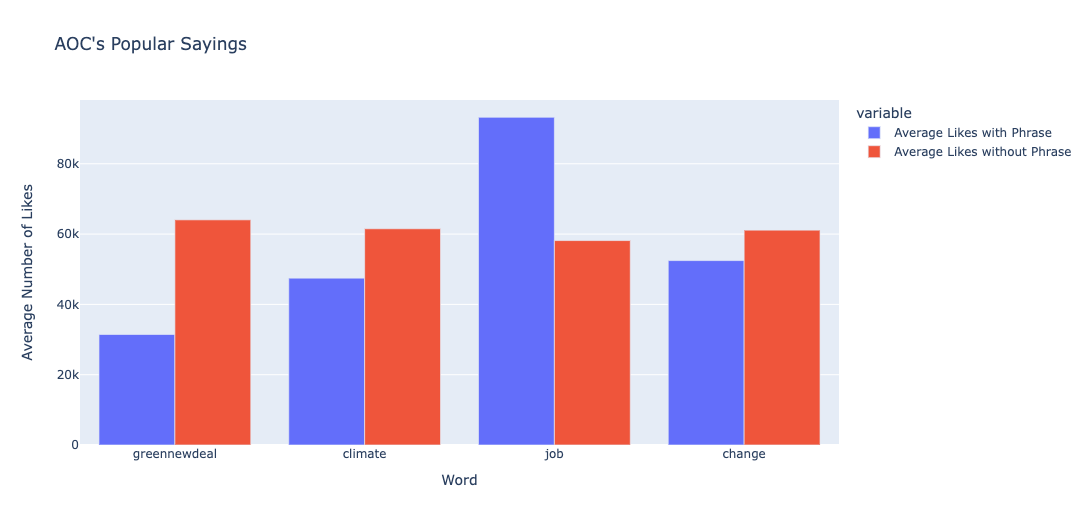
Graph 3: Do Buzz Words work?
This bar graph analyzes AOC’s popular sayings. The graph portrays the effectiveness of using recurring catchphrases by comparing the average number of likes to whether or not AOC used a particular saying. For this graph, we looked at four of AOC’s popular sayings: “Green New Deal”, “Climate”, “Job”, and “Change”. The data shows that for “Green New Deal”, “Climate”, and “Change”, her tweets underperformed. However they overperformed when she used the keyword “job”.
Insight: "Less political" buzzwords work for AOC, "more political" buzzwords do not.
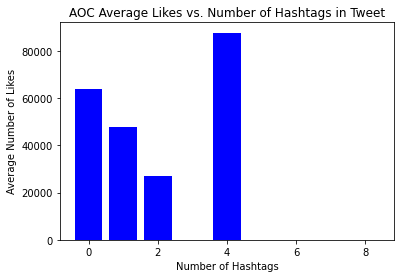
Graph 4: Do Hashtags Work?
This bar graph analyzes AOC’s success per use of hashtags. The graph portrays the effectiveness of using hashtags by comparing the average number of likes to the number of hashtags used in a particular tweet. The data shows that the more hashtags AOC used, the less likes she received on her tweet up until 2 hashtags. If she used 4 hashtags, then they were very successful.
Insight: More hashtags means less successful tweets, unless it’s four hashtags.
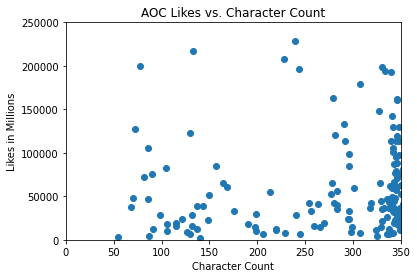
Graph 5: Does Character Account Affect Likes?
This scatterplot analyzes AOC’s success per length of tweet. The graph portrays the success of having longer tweets vs. shorter tweets by comparing the average likes in millions to the character count. The data shows that more of AOC’s tweets trend towards longer. There appears to be a slight correlation between longer tweets and increased likes.
Insight: Longer tweets perform slightly better for AOC.