A look into how the former President uses (or used) Twitter
Basic Stats:
Twitter Handle
Average Likes per Tweet
Size of Data set
Average Length per Tweet (Characters)
Duration
Frequent Word
@realDonaldTrump
28,350
56571
128
May 2009 - Jan 2021
CNN
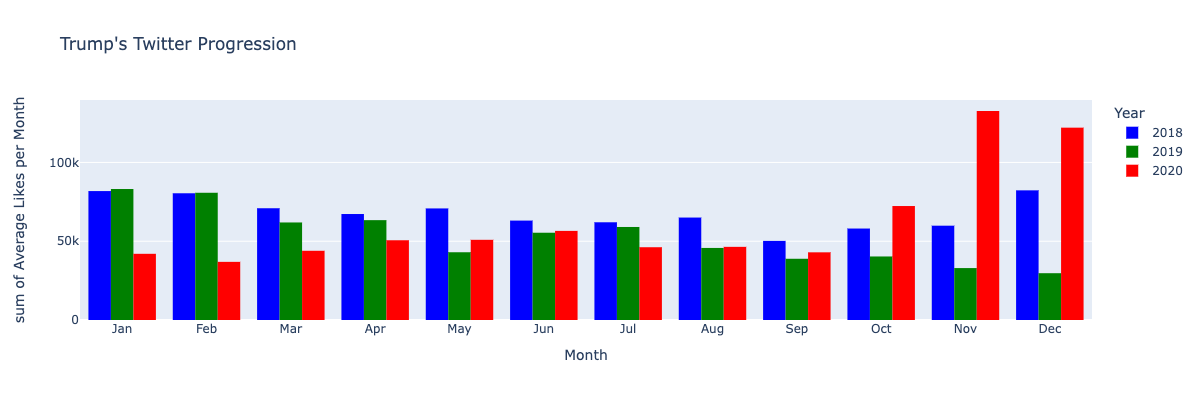
Graph 1: Account Improvement
This bar graph analyzes former president Donald Trump’s monthly tweet success in the years 2018, 2019, and 2020. The graph portrays the success of tweeting during a particular month by comparing the average number of likes to the month during which Trump tweeted. For this graph, each number corresponds to its month (1 - Jan, 2 - Feb, etc.). This data shows that Trump’s most successful tweets were during the months of January and February. This data shows that Trump’s tweet popularity remained relatively from year to year, but grew exponentially in November and December of 2020 following the heated 2020 election.
Insight: Trump maintained a relatively constant success rate for tweets, but outperformed following the 2020 election
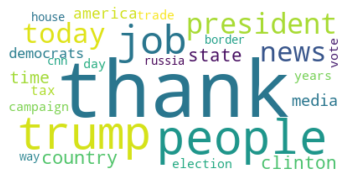
Graph 2: Word Cloud
This word cloud analyzes former president Donald Trump’s most popular words used during his tweets. This graph portrays the frequency of particular words by portraying more frequent words as bigger than the others.
Insight: The most popular twitter words for Trump were “Thank”, “Trump”, “People”, “Job”, “President”, and “Clinton”.
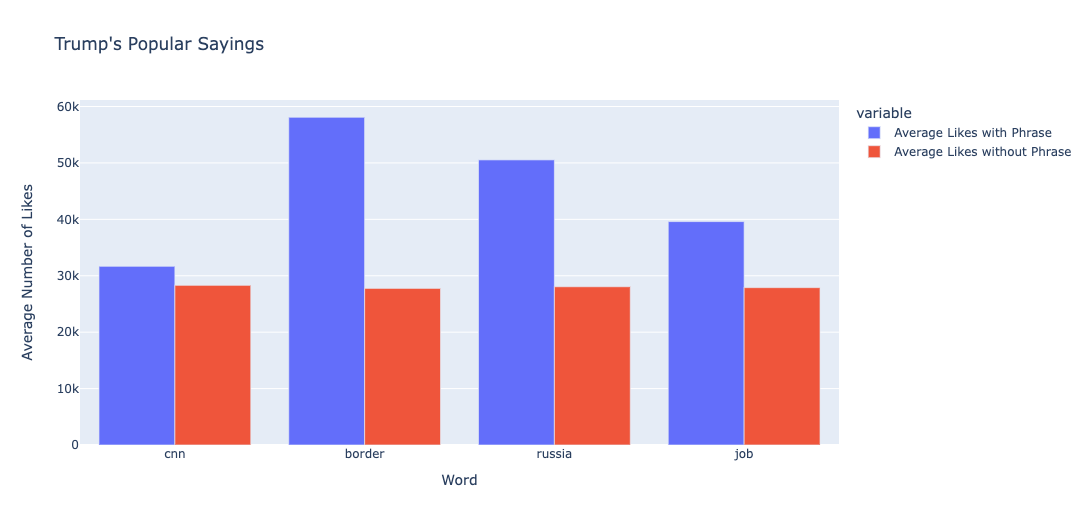
Graph 3: Do Buzz Words work?
This bar graph analyzes former president Donald Trump’s popular sayings. The graph portrays the effectiveness of using recurring catchphrases by comparing the average number of likes to whether or not Trump used a particular saying. For this graph, we looked at four of Trump’s popular sayings: “CNN”, “Border”, “Russia”, and “Job”. The data shows that when Trump used one of these sayings his tweets received more likes.
Insight: Catch phrases work for Trump
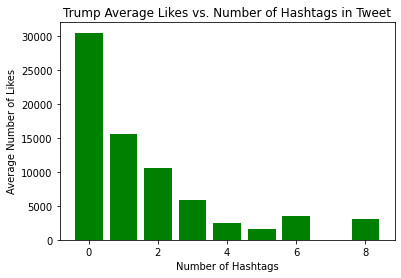
Graph 4: Do Hashtags work?
This bar graph analyzes former president Donald Trump’s success per use of hashtags. The graph portrays the effectiveness of using hashtags by comparing the average number of likes to the number of hashtags used in a particular tweet. The data shows that the more hashtags Trump used, the less likes he received on his tweets. However, the cumulative data for using hashtags(1, 2, 3, etc. being added) show that using hashtags make tweets perform better (shown in comparison tab)
Insight: More hashtags mean less successful tweets
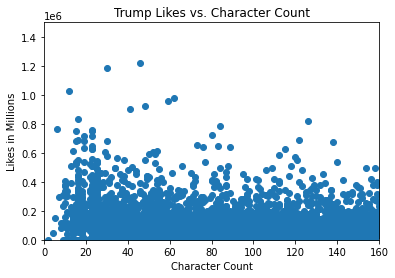
Graph 5: Does Character Count Account Affect Likes?
This scatterplot analyzes former president Donald Trump’s success per length of tweet. The graph portrays the success of having longer tweets vs. shorter tweets by comparing the average likes in millions to the character count. The data shows that Trump’s tweets are slightly more successful when they are shorter tweets. It should also be noted that this data was truncated at 1.5 million likes, but there are tweets that received up to 2 million likes. There is a clear upward trend up to ~20 characters then a gradual dropoff for tweets longer than ~20 characters.