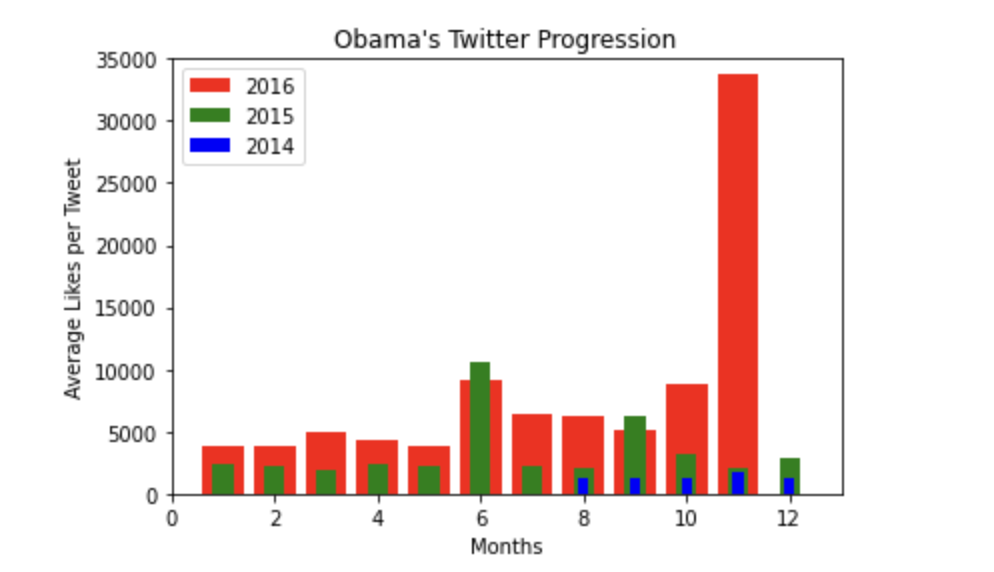
This bar graph analyzes former president Barack Obama’s monthly tweet success in the years 2014, 2015, 2016. The graph portrays the success of tweeting during a particular month by comparing the average number of likes to the month during which Obama tweeted. For this graph, each number corresponds to its month (1 - Jan, 2 - Feb, etc.). This data shows that Obama’s most successful tweets were during the months of July and August. This data had to be put into a separate graph than the 2017 data because on average, Obama received less likes in the years 2014-2016 than in 2017. This data shows that Obama’s popularity tweet popularity grew from year to year and typically performed better from June to November.
Insight: As time went on, Obama’s tweets received more likes.
Graph 2: Account Improvement (2017)
This bar graph analyzes former president Barack Obama’s monthly tweet success in the year 2017. The graph portrays the success of tweeting during a particular month by comparing the average number of likes to the month during which Obama tweeted. For this graph, each number corresponds to its month (1 - Jan, 2 - Feb, etc.). It should be noted that the api used for Obama only went up until October of 2017. Therefore, there is no data for November and December of 2017. This data shows that Obama’s most successful tweets were during the months of July and August. It should also be noted that despite having a relatively small average like count for 2014 - 2016, Obama’s twitter exploded during Trump’s first year of presidency in 2017.
Insight: As Trump’s presidency went on, Obama’s twitter received more likes.
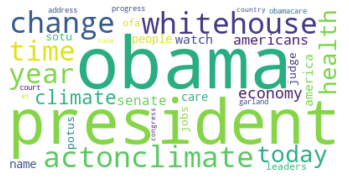
Graph 3: Word Cloud
This word cloud analyzes former president Barack Obama’s most popular words used during his tweets. This graph portrays the frequency of particular words by portraying more frequent words as bigger than the others.
Insight: The most popular twitter words for Obama were “Obama”, “President”, “Actonclimate”, “Health”, “Change”, and “Whitehouse”.
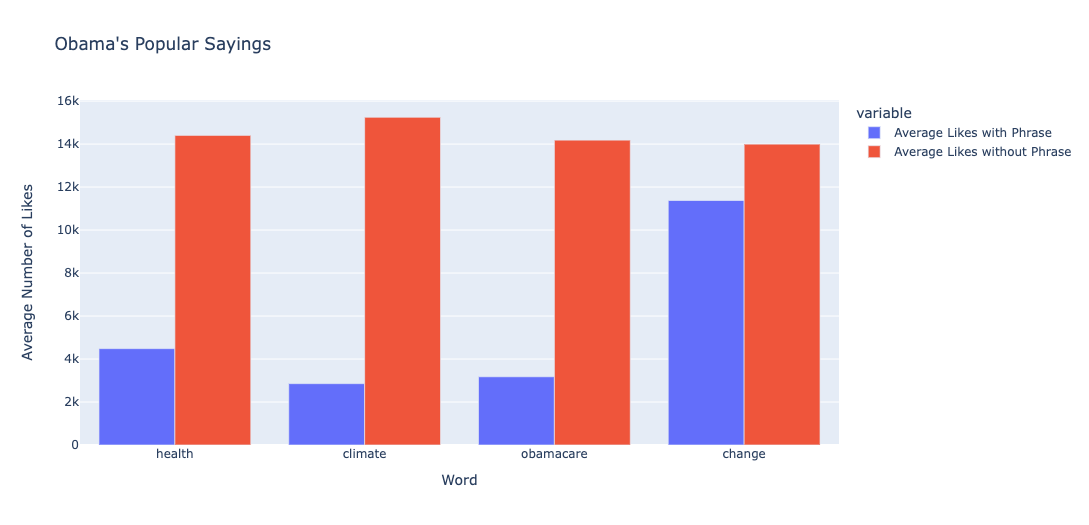
Graph 4: Do Buzz Words work?
This bar graph analyzes former president Barack Obama’s popular sayings. The graph portrays the effectiveness of using recurring catchphrases by comparing the average number of likes to whether or not Obama used a particular saying. For this graph, we looked at four of Obama's top sayings: “health”, “climate”, “Obamacare”, and “change”. The data shows that when Obama uses one of these sayings his tweets will receive less likes.
Insight: catch phrases don’t work for Obama.
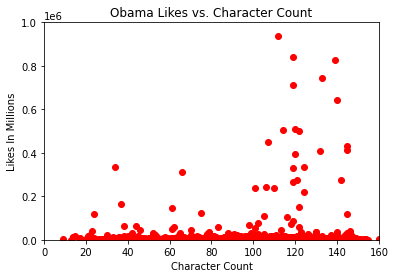
Graph 5: Does Character Count Affect Likes?
This scatterplot analyzes former president Barack Obama’s success per length of tweet. The graph portrays the success of having longer tweets vs. shorter tweets by comparing the average likes in millions to the character count. The data shows that Obama’s tweets are more successful when he types out longer tweets. It should also be noted that this data was truncated at 1 million likes, but there are tweets that received up to 4 million likes.
Insight: Longer tweets increases the likelihood of receiving more likes